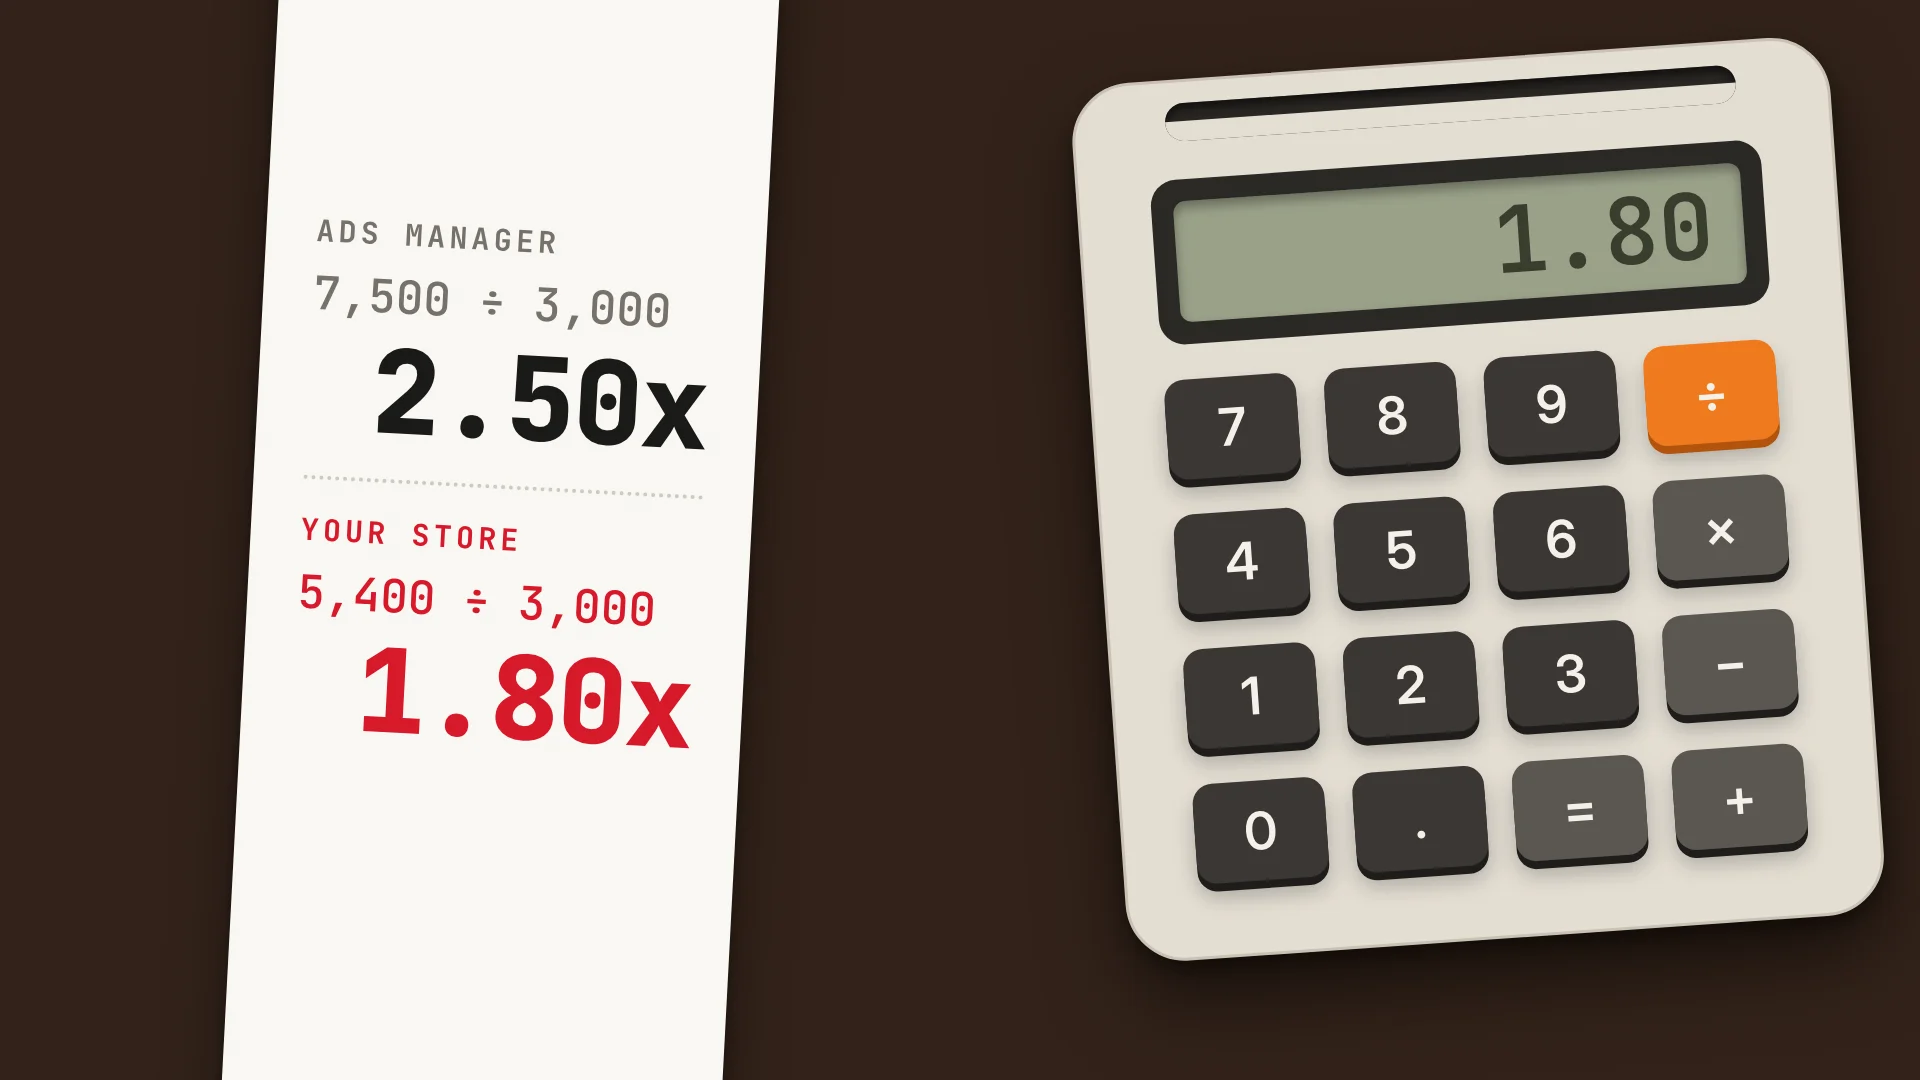
The ROAS formula is revenue from ads ÷ ad spend.
ROAS = revenue from ads ÷ ad spendIf you spend $3,000 on ads and they bring in $7,500, your ROAS is 2.5, which you'll also see written as 2.5:1, 250% or 2.5x, and it means every $1 you spent brought back $2.50. ROAS stands for return on ad spend.
It's one division, and you can do it perfectly and still scale the wrong campaign, because the revenue number you put on top can be 30-40% off what your store actually made.
So below I'll show you how to calculate ROAS, where that revenue number should come from, and the ROAS you really need to make a profit.
How to calculate ROAS, step by step
Here's how to calculate ROAS step by step, because if your spend and your revenue come from different date ranges, the formula gives you a number that looks fine and means nothing.
- Pick a period, like the last 7 days or the last 30.
- Take your ad spend for that period.
- Take the revenue from those ads for the same period. This is where it gets tricky, more on that in the next section.
- Divide the revenue by the spend.
Where it usually goes wrong is mixing the 2 sides up. This week's spend gets divided into sales that came in over the last month, or one campaign's spend gets divided into the whole account's revenue.
Keep both sides the same: same period, same campaign.
Whichever way you write the result (decimal, ratio, percentage or multiplier) it's the same number, and to get the percentage you multiply by 100. If it comes out below 1, you got back less than you spent.
Here are 3 examples, using example numbers:
| Ad spend | Revenue from ads | ROAS | As a % |
|---|---|---|---|
| $3,000 | $7,500 | 2.5x | 250% |
| $1,000 | $4,000 | 4.0x | 400% |
| $500 | $400 | 0.8x | 80% |
Use the same period and the same campaign on both sides, divide the revenue by the spend, and that's your ROAS.
Where the revenue in your ROAS formula comes from (and why it's often wrong)
So where does "revenue from ads" come from?
For most advertisers it's the purchase value Ads Manager reports (the number behind its purchase ROAS column), and that number can be far enough off what your store recorded to make a campaign that's losing money look like it's working.
A lot of advertisers open Ads Manager, look at purchase ROAS and decide which campaigns get more budget and which get turned off. Then they open Shopify, see a different revenue number, and don't know which one goes in the formula.
They don't match because they're counting different things. Ads Manager reports the sales Meta gives itself credit for, and your store reports the sales that actually happened. So they rarely line up, and Ads Manager can be off either way.
There are 3 main reasons for the gap.
1. Attribution windows
By default, Meta counts a sale as coming from your ad if it happens within 7 days of someone clicking it, or within 1 day of someone seeing it.
That second part is view-through credit, which means someone who scrolled past your ad without clicking and bought later that day can still count as an ad sale. This pushes the Ads Manager number up.
2. Sales Meta can't see
Some sales never reach Meta at all. People who opted out of tracking on iOS, people running ad blockers, and events Meta blocks or restricts for some product categories (more on restricted categories) all buy in your store without Meta hearing about it.
These push the Ads Manager number down, so a campaign can be doing better than it looks.
3. Sales counted twice
The pixel and the Conversions API can both send the same purchase, and if they aren't set up to deduplicate it, Meta counts it twice.
A pixel that fires twice on the thank-you page does the same thing. This pushes the Ads Manager number up (and makes your cost per purchase look lower than it is, which I covered in what Facebook ads cost).
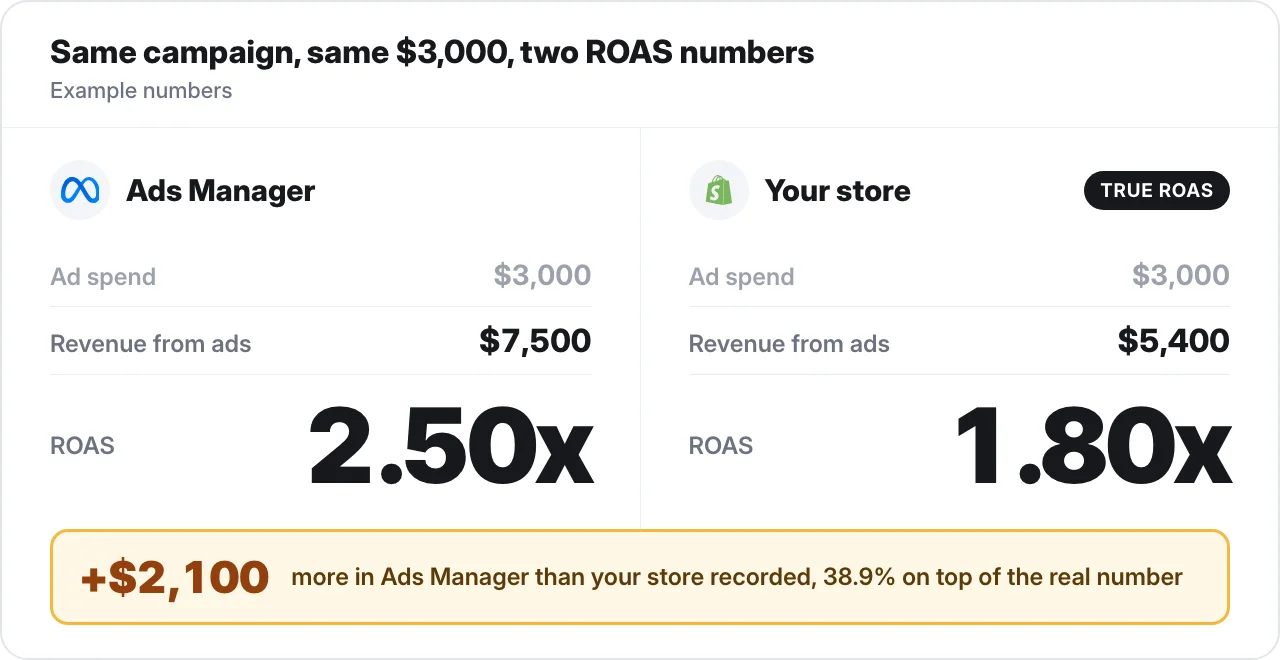
Here's what the gap looks like on one campaign, with example numbers:
- Ad spend: $3,000
- Revenue in Ads Manager: $7,500, so ROAS is 2.50x
- Revenue your store recorded from the ad: $5,400, so ROAS is 1.80x
Ads Manager is showing $2,100 more than your store recorded, which is 38.9% on top of the real number.
A 30-40% gap like this gets treated as normal on every forum. Somebody posts that Ads Manager and Shopify don't match, and the replies tell them 30% is normal and to move on.
It isn't. What we see with our clients is that once the sales are tracked properly and sent back to Meta, the gap gets under 10%.
Your true ROAS is the one worked out from the sales your store recorded from the ad, and in this example that's 1.80x, not the 2.50x Ads Manager shows.
What is a good ROAS? Anything above your break-even
Once you have a ROAS you can trust, the next question is whether it's any good, and if you answer that with an industry average, you can end up scaling a campaign that loses money on every order.
The way it normally goes, you search "what is a good ROAS" or "good ROAS for Facebook ads", land on a rule of thumb like 3:1 or 4:1, and judge every campaign against it.
The problem is that an average doesn't know your margin. ROAS is revenue, not profit, so the ROAS you need depends on how much of each sale is left after your costs.
Take 2 stores at a 3.0x ROAS, with example numbers. One keeps 50% of every sale after costs and the other keeps 25%, and at 3.0x the ads cost about 33% of every sale.
So the first store keeps about 17% of each sale as profit, and the second one loses about 8% on every order.
The averages online are fine for a rough sense of what other advertisers see, and useless as a target for your own campaigns.
A good ROAS is any ROAS above your own break-even: a store on a 50% margin breaks even at 2.0x, and a store on a 25% margin needs 4.0x just to stand still.
The break-even ROAS formula: the number your ads have to beat
To know if you're above break-even you need your own break-even number, and it's easy to work it out in a way that makes losing campaigns look fine.
Break-even ROAS = 1 ÷ profit margin before adsProfit margin before ads is what's left of an order after every cost except the ads, divided by the order value.
Where it goes wrong is working out margin as price minus product cost and stopping there. Shipping, payment fees and refunds get left out, and every one you leave out makes your margin look bigger and your break-even look smaller than it really is.
Here it is with example numbers, per order:
| Per order | Example numbers |
|---|---|
| Average order value | $60.00 |
| Product cost (COGS) | $18.00 |
| Shipping | $8.00 |
| Payment fees | $2.04 |
| Refunds | $1.80 |
| Left before ads | $30.16 |
Profit margin before ads = $30.16 ÷ $60 = 50.3%Break-even ROAS = 1 ÷ 0.503 = 1.99x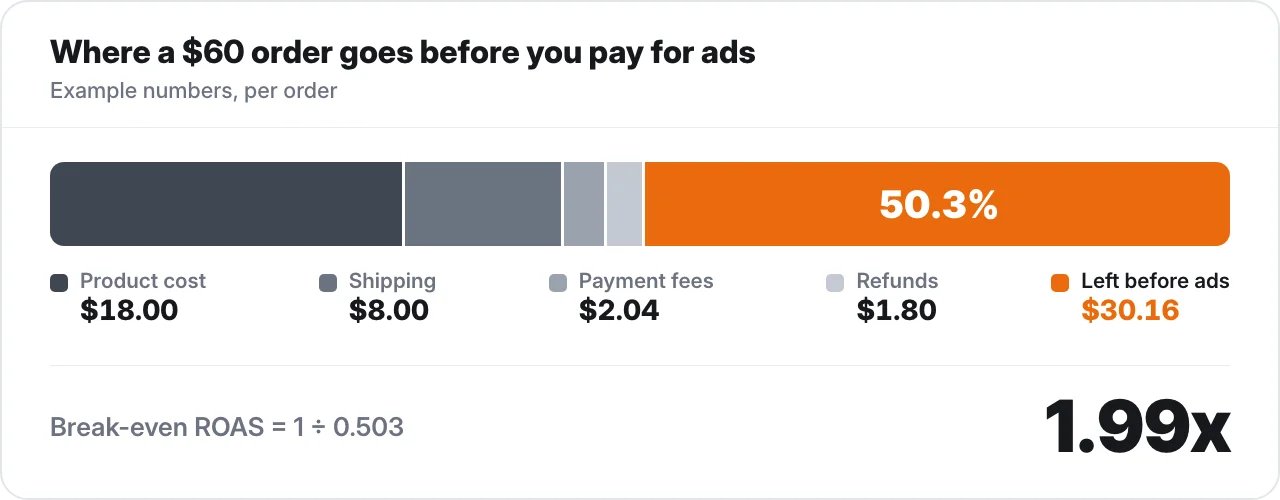
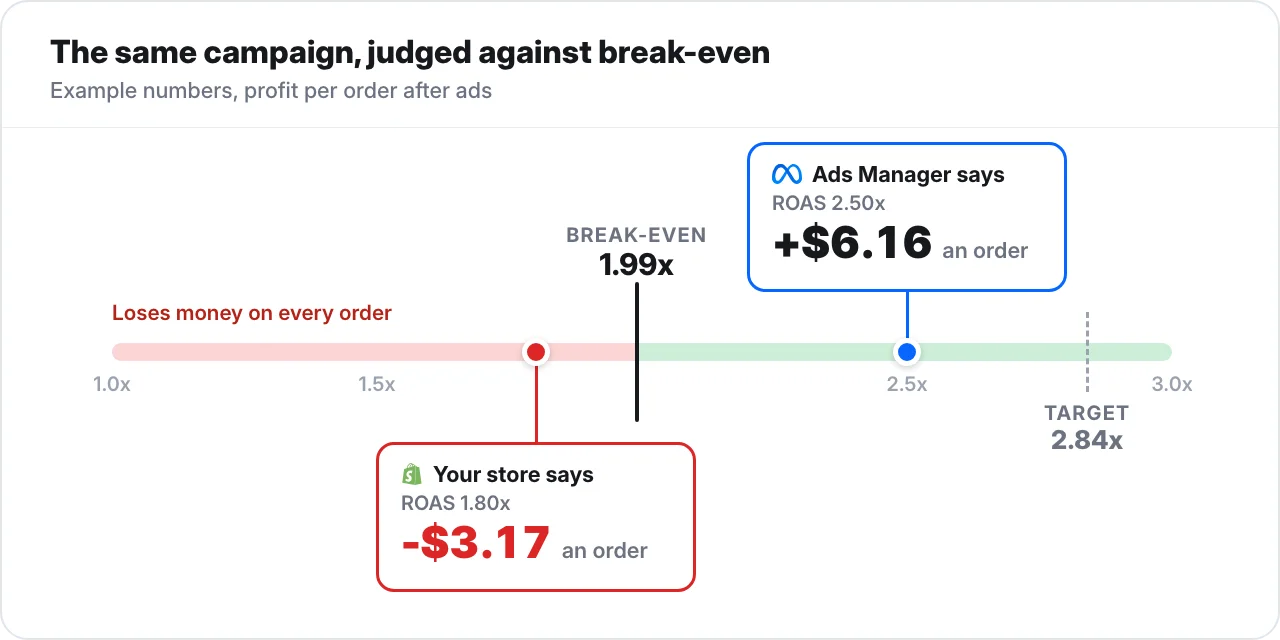
Here's what that means per order. At a 1.8x ROAS you spend $33.33 in ads to get a $60 order, so you lose $3.17 on every order. At 2.5x you spend $24, so you make $6.16.
(Those 2 ROAS numbers should look familiar from the Ads Manager example, and I'll come back to them.)
The break-even ROAS calculator works this out from your own costs if you don't want to do it by hand.
So for this store, 1.99x is the line, and every campaign under it loses money on every order it brings in.
Target ROAS: the number to aim for if you want a profit
Break-even only means the ads paid for themselves, so if that's the ROAS you aim for, you're running ads to make nothing.
A campaign sitting just above it can feel like a win, but every order covered its costs and left you with nothing.
Target ROAS = 1 ÷ (profit margin before ads - profit margin you want)Say the same store wants to keep 15% of every sale as profit. The margin before ads is 50.27% before rounding, so:
Target ROAS = 1 ÷ (0.5027 - 0.15) = 1 ÷ 0.3527 = 2.84xSo for this store, 2.84x is the target you judge a campaign against once you know its ROAS is real, and 1.99x is the line you never let it drop under.
ROAS vs ROI vs MER (blended ROAS)
Before you hold a campaign up to those numbers, make sure it's ROAS you're looking at. It gets mixed up with ROI and MER all the time, and if you judge one against a target set for another, a good campaign looks bad or a bad one looks good.
That looks like being told to hit a 30% ROI and comparing that to a 2.5x ROAS, or seeing a blended number on a dashboard and treating it as one campaign's ROAS.
| Metric | Formula | What it tells you |
|---|---|---|
| ROAS | Revenue from ads ÷ ad spend | How much revenue each campaign brings back for what it costs |
| ROI | (Revenue - all costs) ÷ all costs | Whether you made money after all your costs, not just ads |
| MER (blended ROAS) | Total store revenue ÷ total ad spend across every channel | Whether all your ad spend together is working |
The main difference between ROAS and ROI is that ROAS is built on revenue and ROI is built on profit.
MER uses the revenue your store recorded, so it doesn't depend on any ad platform's attribution, which makes it a good check on the ROAS in Ads Manager. It can't tell you which campaign is working, though.
Use ROAS to judge a campaign, ROI to judge whether the business made money, and MER to check all your ad spend against the revenue that actually landed in your store.
How to use ROAS to decide what to scale and what to cut
The formula, the right revenue, your break-even and your target only lead to the right call when you use all of them on the same campaign.
Go back to the $3,000 campaign from earlier and treat it as the same store from the break-even example, where break-even is 1.99x. Ads Manager says 2.50x, which is comfortably above that. Your store says 1.80x, which is below it.
Put the two examples together and Ads Manager says the campaign makes $6.16 an order while your store says it loses $3.17, and it's the store's number that should decide whether you scale it or turn it off.
The math was right both times, it was the revenue on top that was wrong.
Anyways, the order I'd do it in is to work out your break-even first, then make sure the revenue in your formula is what your store recorded from the ad and not what Ads Manager claims, and only then judge each campaign by that real ROAS against your break-even and your target.
The ROAS calculator does the break-even and target part for you once you plug in your own costs.
And if you want the real revenue number without matching orders to ads by hand, that's what TrueMetriks does.
It tracks each sale back to the ad that made it and sends the real purchases back to Meta, and you can try it free for 7 days, no card needed.
ROAS FAQ
What does ROAS stand for?
ROAS stands for return on ad spend. It's revenue from ads ÷ ad spend, and the version worth trusting uses the sales your store recorded.
How do you write ROAS as a percentage?
Multiply it by 100. A ROAS of 2.5 is 250%, and a ROAS of 0.8 is 80%.
Is ROAS based on revenue or profit?
Revenue. ROAS doesn't know what your products, shipping or fees cost, so you compare it to your break-even ROAS, which is where your margin comes in.
What is a good ROAS for Facebook ads?
Any ROAS above your own break-even. A store on a 50% margin breaks even at 2.0x and a store on a 25% margin needs 4.0x, so an average from someone else's account can't tell you what's good for yours.
Why is my ROAS different in Shopify and Ads Manager?
Ads Manager counts the sales Meta gives itself credit for, and Shopify counts the sales that actually happened. Attribution windows, sales Meta can't see and sales counted twice pull them apart, and the store's number is the one to trust.
What's the difference between ROAS and ROI?
ROAS is revenue from ads ÷ ad spend, so it tells you how much revenue a campaign brings back. ROI is profit after all costs ÷ costs, so it tells you whether you made money once everything is paid for, not just the ads.