Recently I was talking with a friend who does conversion optimization for a lot of brands.
We have worked together on CRO for other stores, so this is the kind of thing we go back and forth on all the time.
He was working on a shop, and he was frustrated. They had done the work, and the numbers weren't paying it back the way they should have.
They cut checkout abandonment from 40% down to 30%. Real split tests, the slow grind of fixing a checkout step by step.
Ten points off abandonment is a genuinely big win. Anyone who has fought to claw back abandoned carts knows how hard those points are to win.
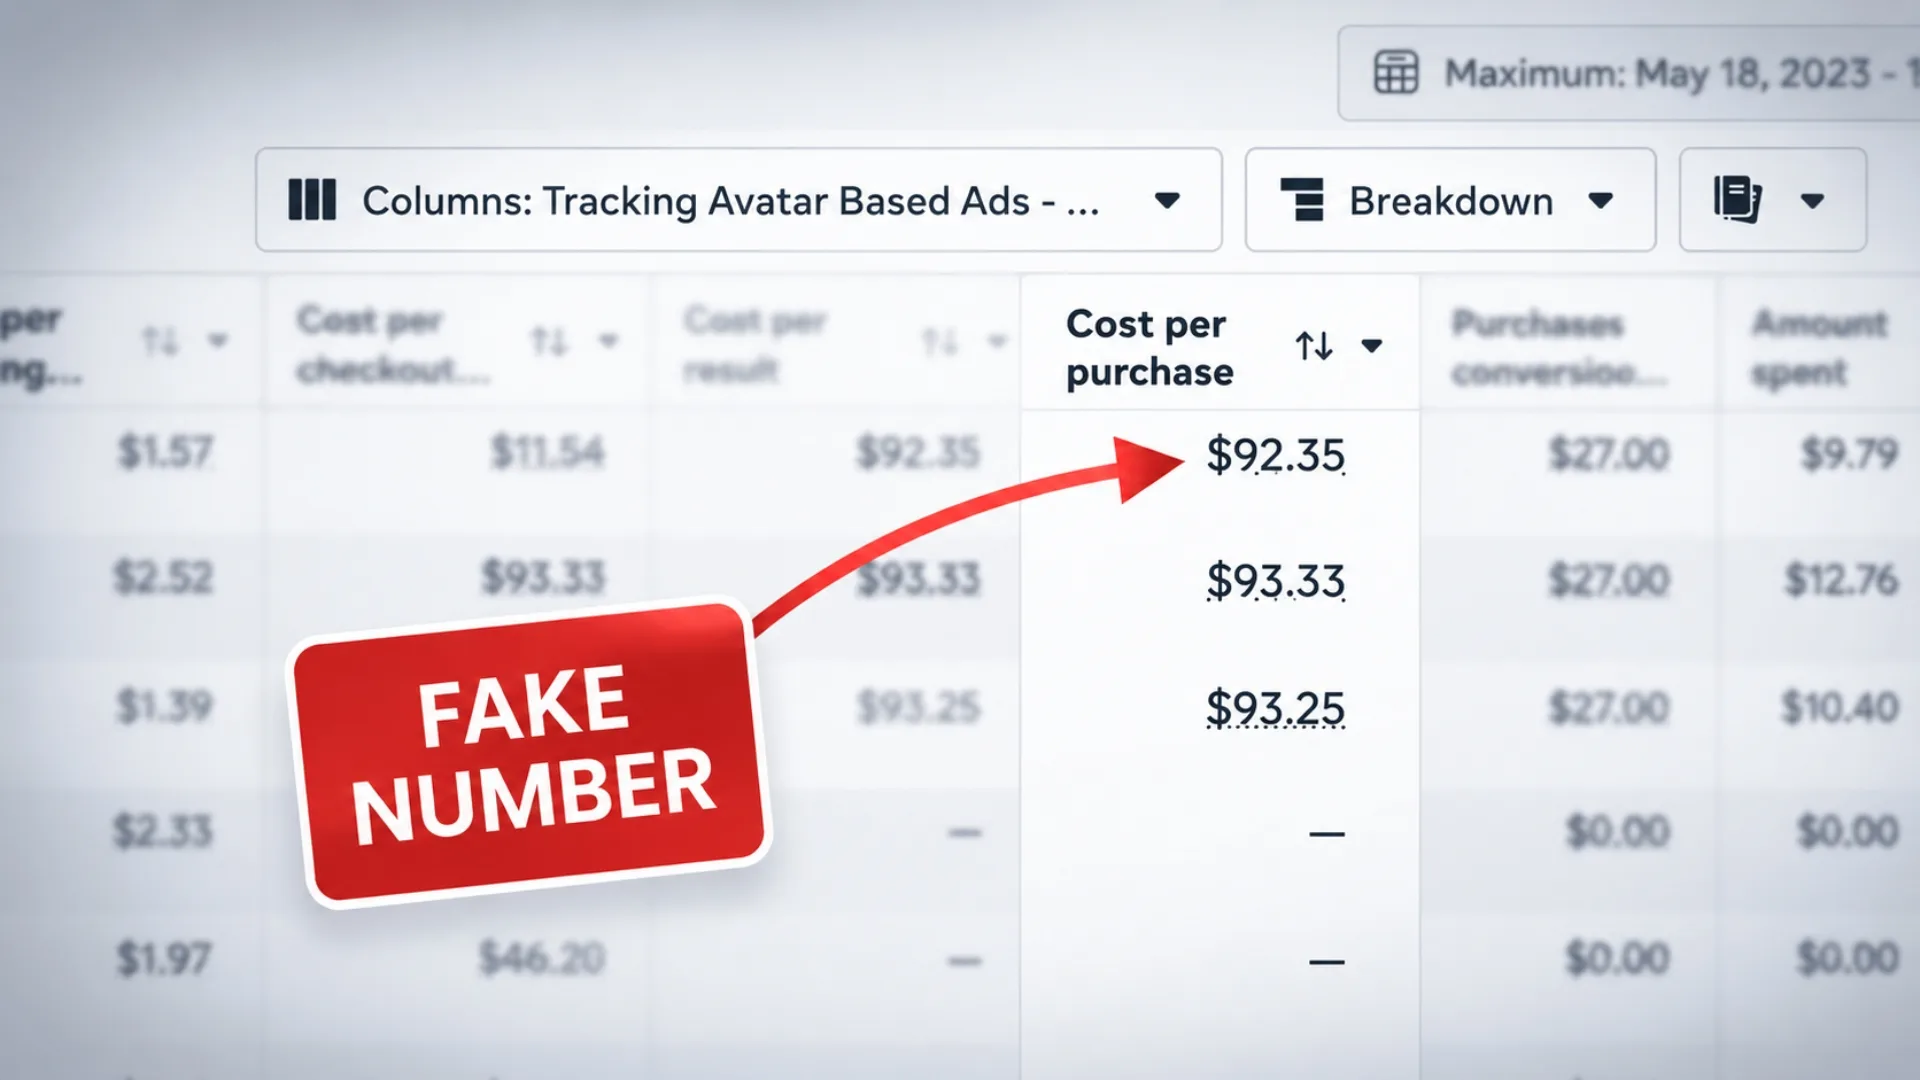
So he went to look at cost per purchase, expecting it to fall hard. It went from $12 to $10.
Two dollars. And for what they sell, in the markets they sell to, $10 is still expensive.
So he asked me the obvious question. How do we push this down further?
The problem is the number, not the result
So if the work was real, the problem isn't the result. It's the number he used to measure it.
And that number is one most advertisers never think to question, because it sits right there in the dashboard looking like the truth.
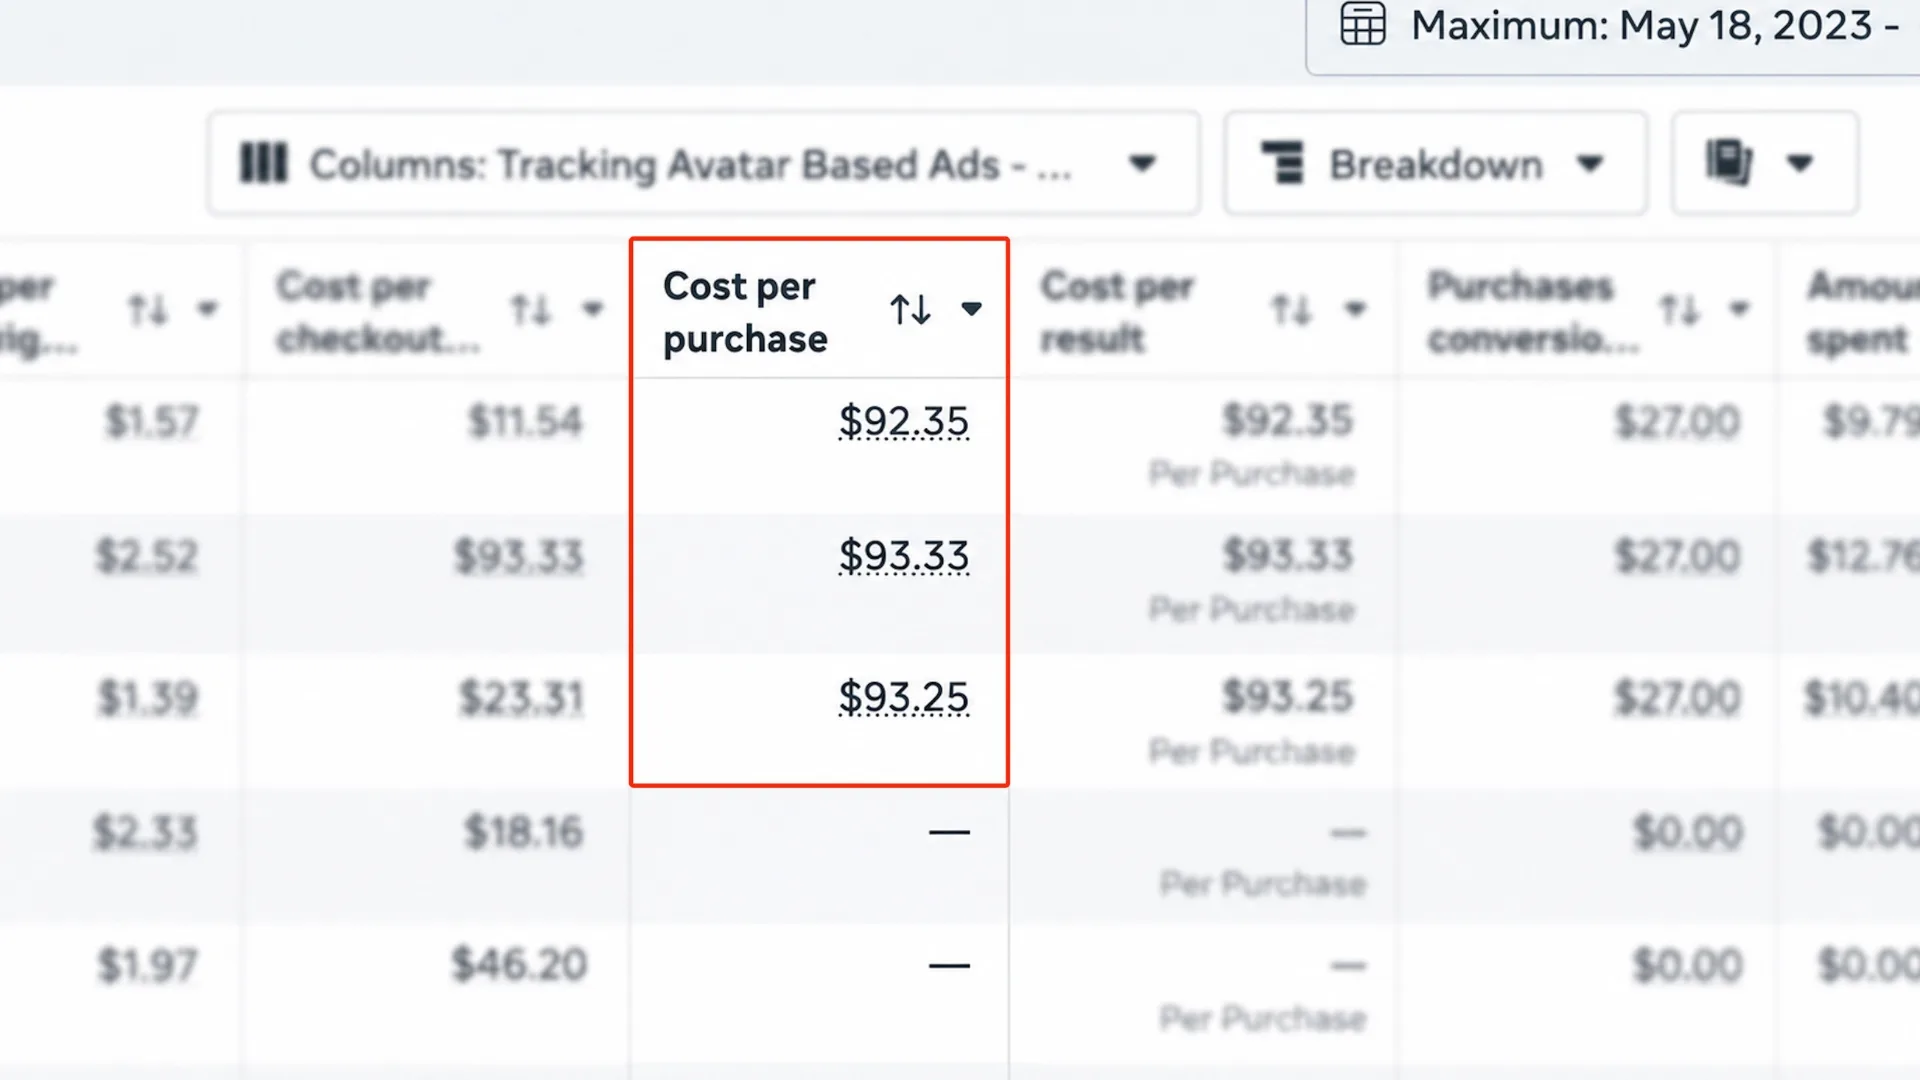
Here is what almost everyone does. They open Facebook Ads Manager, they find cost per purchase, and they read it as their cost per purchase.
Full stop. That number is the scoreboard. It tells them whether they're winning.
But that $10 is only the cost per purchase inside Facebook's attribution window. Seven days.
It counts what happens in the first week and nothing after it. And no real business is built only in the first week.
The complete picture lives past day seven
This is the part he was missing. The same people who buy through that checkout don't go quiet after the first order.
The back end keeps working on them. Email marketing brings them back.
Follow-up offers, repeat purchases, the second and third order that a good back end is built to produce.
All of that happens well past day seven, and none of that shows up next to the original ad which brought those buyers in.
On top of that, Facebook credits whichever ad someone clicked last before buying.
So if those same customers clicked another ad before they purchased, that later ad takes the sale, and the one that actually brought them in gets nothing.
So when he reads $10, he is reading the cost of a first purchase in the first week. He is not seeing the customer that first purchase turned into.
The real economics of that buyer include everything the back end earns after the window closes, and the dashboard shows him none of it.
I see this constantly across real accounts.
Advertisers judge a customer by the seven-day window, decide the math is too expensive, and pull back, while that same customer is quietly profitable the moment you count the back end.
They had a channel that was working, called it too costly, and walked away from it, because the number looked honest and the number was only ever half the story.
His real cost per purchase was better than $10. The window just could not see the sales that made it so.
How to actually push the number down
So what's the fix?
You need to see what a customer is worth past the seven-day window, not just inside it.
Once you widen the window and count the back end, the email revenue, the repeat orders, you finally see the true cost per purchase and the true return on the work you did.
The full result, not the slice.
You cannot trust a cost per purchase metric when the window measuring it is too narrow to count how much revenue the customer actually brings in.
That isn't optimizing. That is optimizing blind against a number that was never able to score you fairly.
And it goes wrong in two directions at once.
You walk away from revenue channels and offers that actually work, because the first week made them look too expensive.
And you keep tuning toward whatever the seven-day window happens to reward, which is not what actually grows the business.
Second, every downstream decision rides on a number that can only see part of the picture, which can cause long-term damage to the business.
So go back through your own account.
Every result that looked too expensive, every fix that "barely did anything," might look completely different once you count what happens after day seven.
The number on the screen was never the whole result. It was only ever whatever the window was wide enough to see.