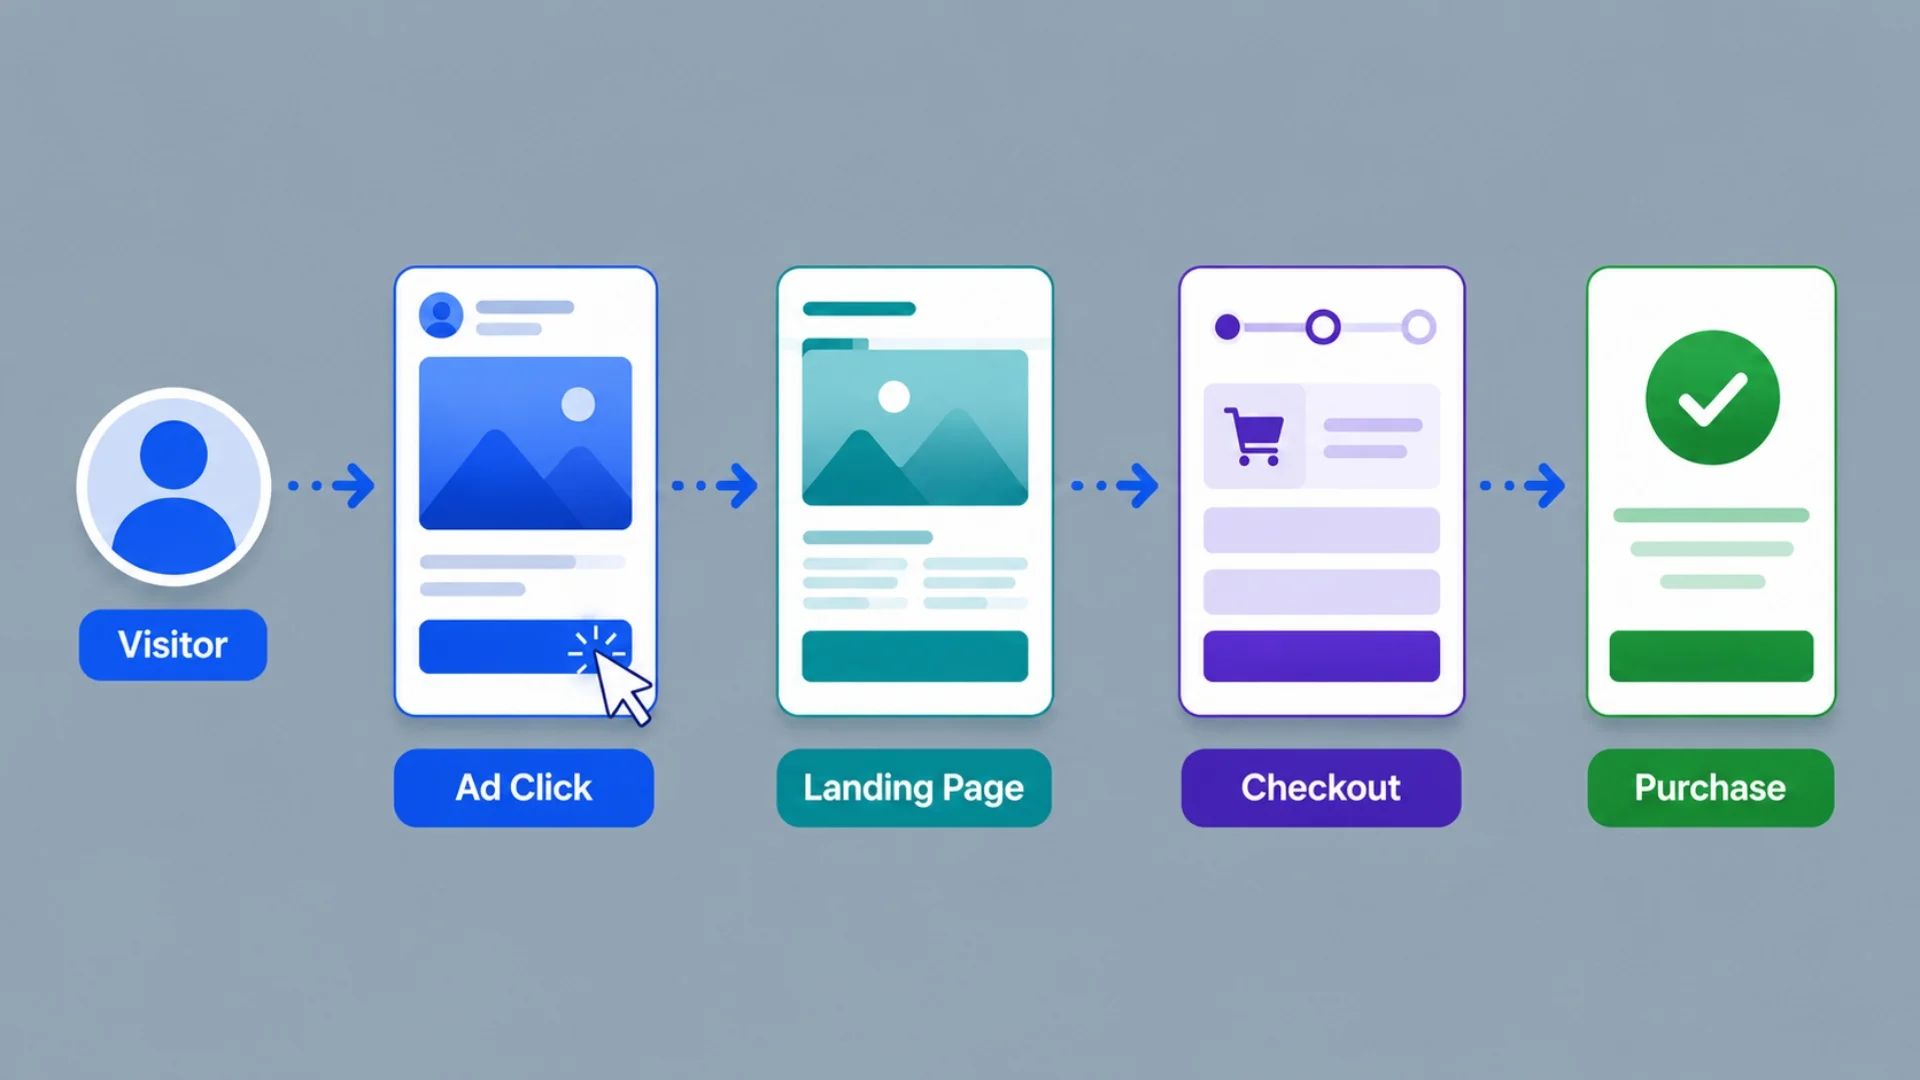
When you're running traffic on any ad platform, Facebook or Google, you already have everything you need to optimize your funnel.
The numbers are already sitting in your ad account. Your only job is to move people from one step to the next.
The five steps
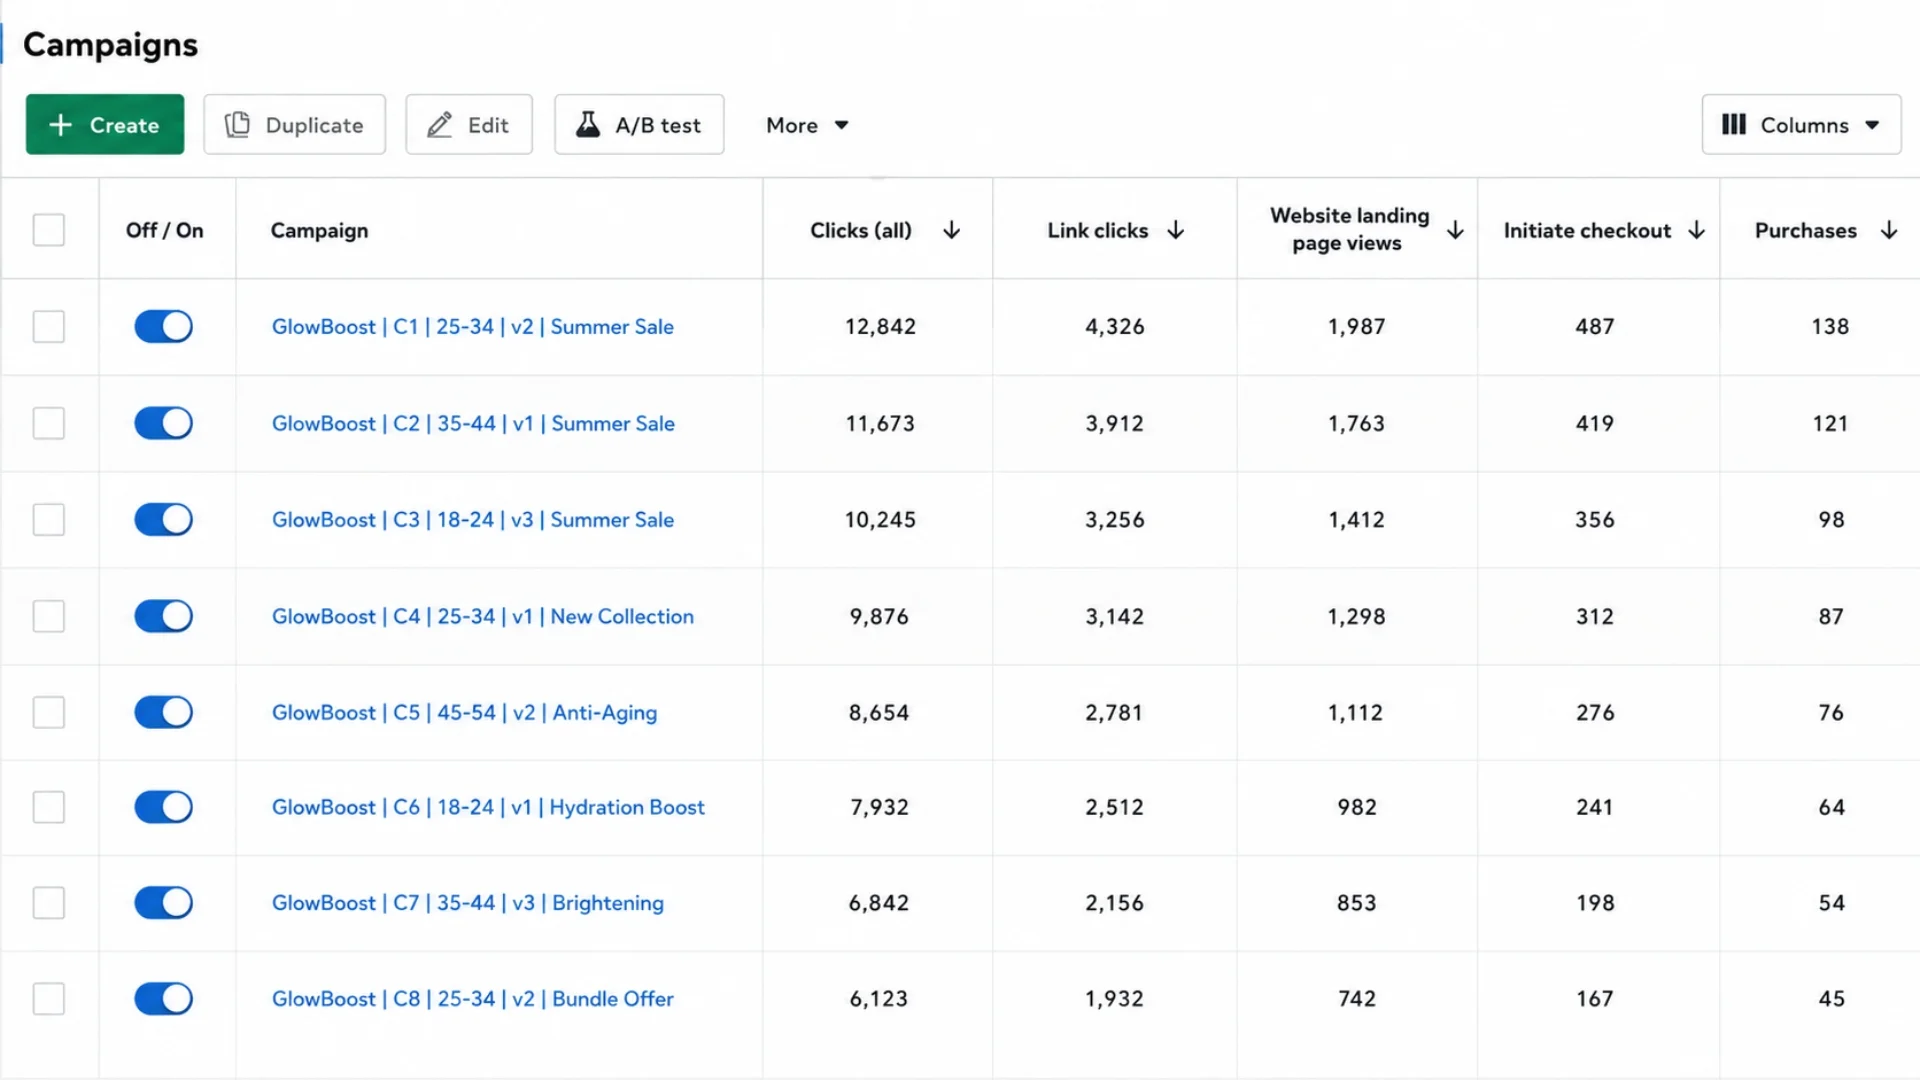
There are five steps before somebody buys: clicks all, link clicks, landing page view, checkout, and purchase.
Every dollar your ads spend does one thing, move a person from one step to the other starting with clicks all.
The gap between each step is a ratio. When a ratio collapses, that's your leak. Read them in order and you'll know the one thing to fix.
One rule before you start. Sales are the master metric. A ratio only matters when the sales aren't coming in.
If the sales are there, leave the ratios alone, even the ugly-looking ones. Only when the sales dry up you start looking at the ratios to spot your leaks.
Clicks all
Clicks all counts every click your ad gets. A like, a share, a comment, someone tapping to expand the copy and read more, and the link click itself.
It's a bucket of every interaction on the ad. A safe assumption is that most of those clicks are people expanding the copy to read it.
So if your clicks all number is low, that tells you something before you read any ratio at all. Nobody's engaging. The creative and the copy aren't pulling.
How to improve it is simple. Change the creative and the copy until people start interacting with the ad. That's the whole fix at this step.
Link clicks
Link clicks are the people who actually clicked through to your site.
To read this, compare clicks all to link clicks. You want roughly 2:1 or 3:1 ratio between clicks all to link clicks.
A hundred clicks all should give you around fifty link clicks at 2:1, or thirty-plus at 3:1.
That's a healthy ad. People engage with it, and a solid chunk of them follow the link onto your site.
When that ratio stretches well past 3:1 and the sales aren't there, the ad is your leak. People will interact with the ad, read the copy, and then go nowhere.
The copy and creative are getting attention but failing to move anyone onto the site. To improve it, make the copy strong enough to earn the click, not just the engagement.
After link clicks, the next number is landing page views, and here's the thing about that gap. You'll never get a 100% match from link clicks to landing page views.
You always lose some, usually 10-20%, mostly to bot and junk traffic. A hundred link clicks turning into 80 or 90 landing page views is completely normal.
When your tracking is set up correctly, that loss is bots, not a broken pixel. Bots click, they don't load pages.
But all of this rests on one thing. Your data has to be accurate and actually sent back, or every ratio you just read is a lie. That's exactly what TrueMetriks is built to do.
Lose a lot more than 20 percent and you've got one of two problems. Either real bot and bad traffic chewing through your clicks, or a landing page that loads too slowly and people bail before it ever renders.
The landing page itself is just the landing page. There's nothing to read on it on its own. The ratios around it are what tell you the story.
Landing page to checkout
This is the conversion ratio for the landing page itself. Page views in, checkouts out.
How many of the people who actually saw the page were convinced enough to start buying.
Run a real number through it. A hundred people see the page, two of them reach checkout. That's a brutal ratio, and it means one thing. The page isn't doing its job.
By this point everything before the page already worked. The ad pulled people off the platform. The traffic was real, because they loaded the page. The page rendered, because they saw it.
So if almost nobody moves from seeing the page to starting a checkout, it's the page. The copy, the offer, the layout, the clarity. Fix the landing page.
Checkout to purchase
This measures the checkout page the same way the last ratio measured the landing page. Checkouts started, purchases completed.
These people already wanted to buy. They went through the whole funnel, saw the offer, decided they wanted it, and proceeded to buy.
So when this ratio collapses, when people reach checkout and don't complete, something on the checkout page is physically or emotionally in the way.
A surprise shipping cost that shows up at the last second. A forced account creation. A broken form field. Too many steps. A missing payment option they actually use.
The person was already sold. Find what's stopping them and clear it out of the way.
How to do this in Facebook
Facebook makes this easy, because it hands you the columns natively. Clicks all, link clicks, landing page views, checkout, and purchase are already built in.
Add them to your view and read them straight down the chain.
One note on the wording. When Facebook says "landing page," it means strictly the landing page of the URL you gave the ad platform.
Not some other page on your site. The destination you actually pointed the ad at.
How to do this in Google
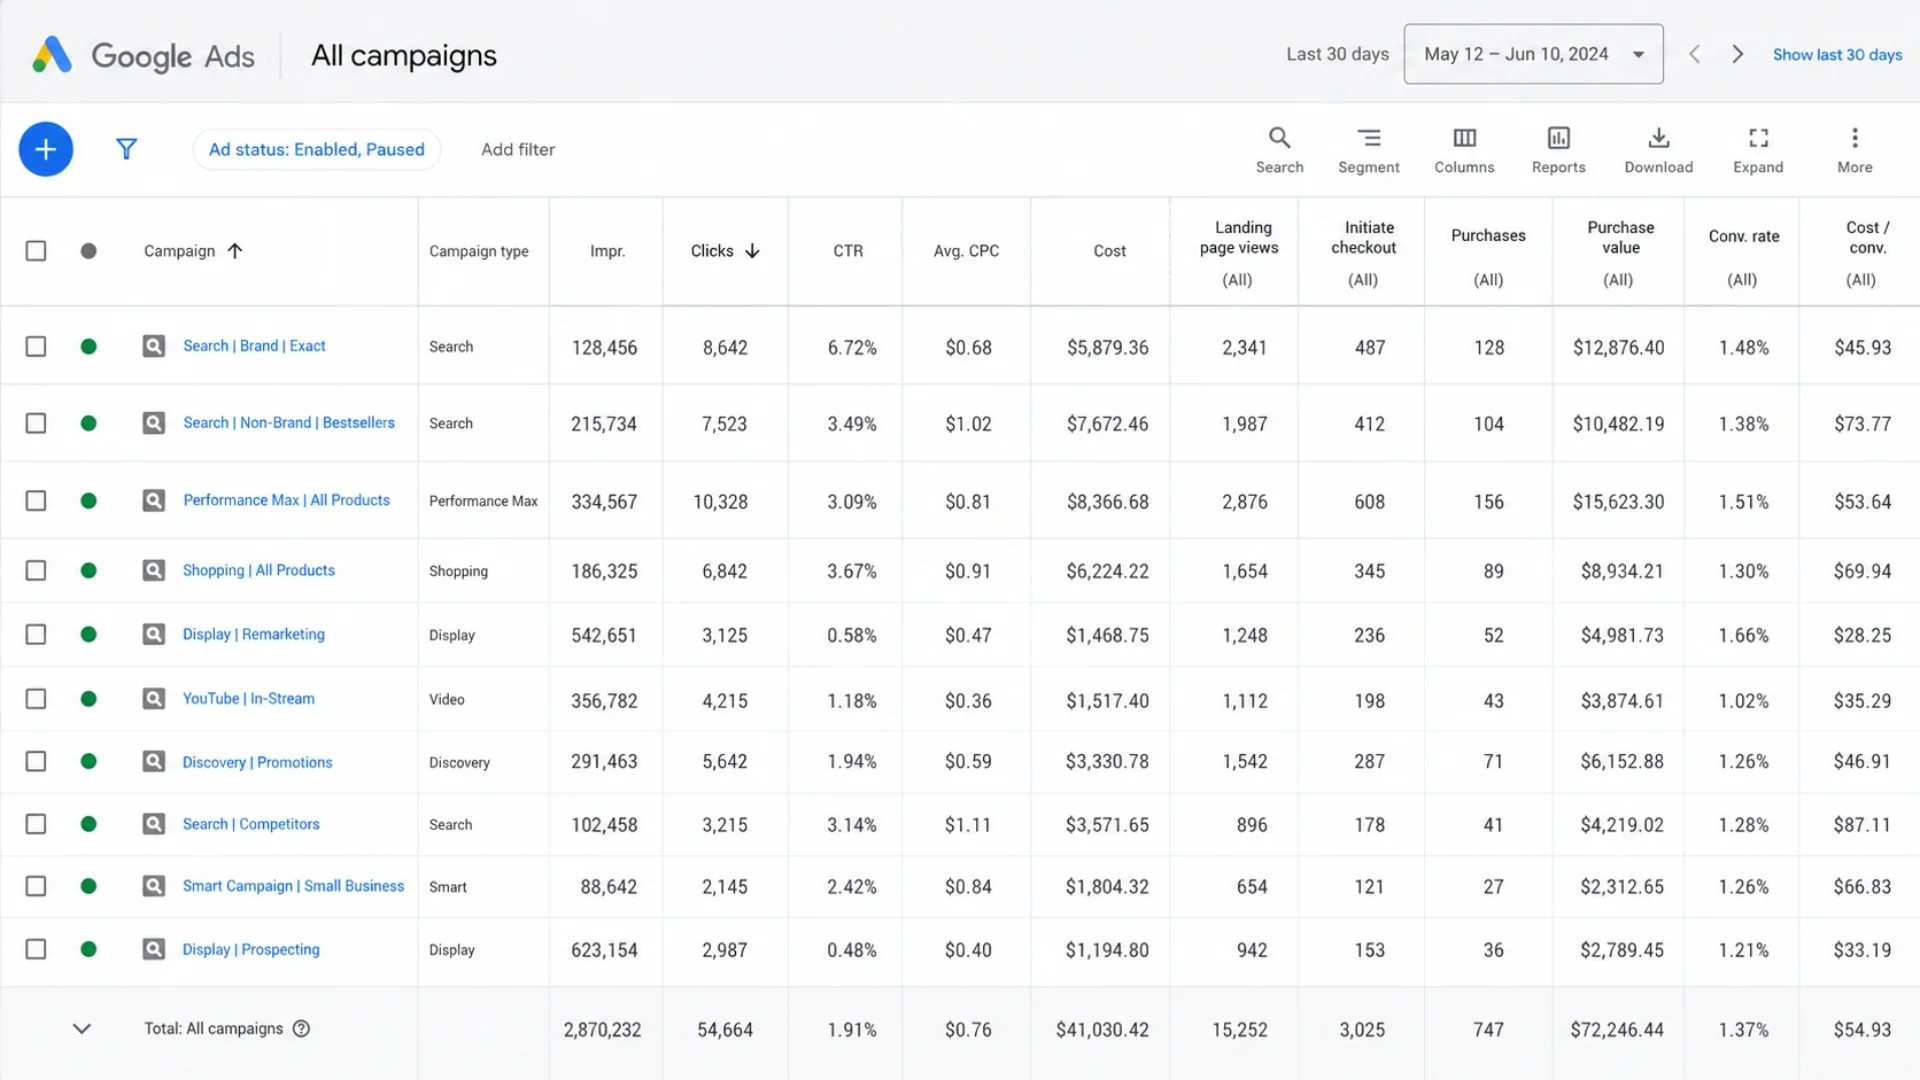
Google Ads runs the exact same funnel with the exact same ratios. People click, they load a page, they start a checkout, they buy.
The only difference is Google doesn't lay the columns out for you. You build them yourself.
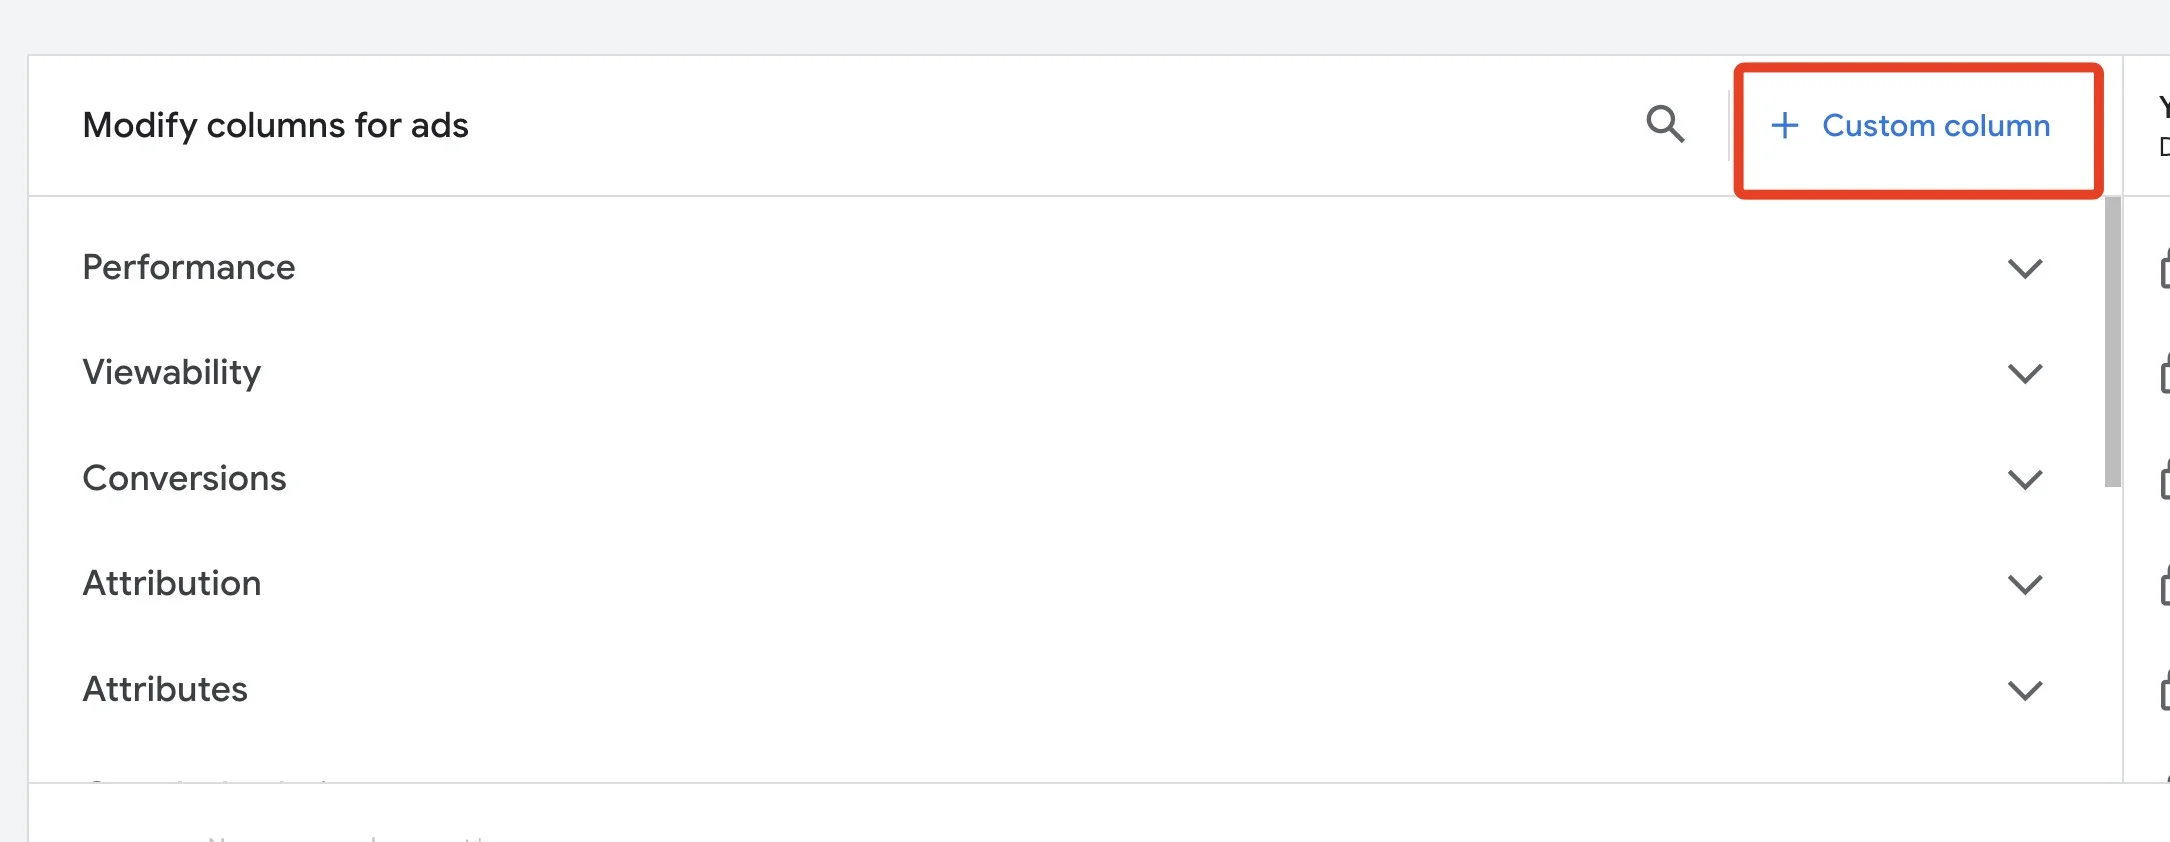
In the Google Ads dashboard, click on Columns.
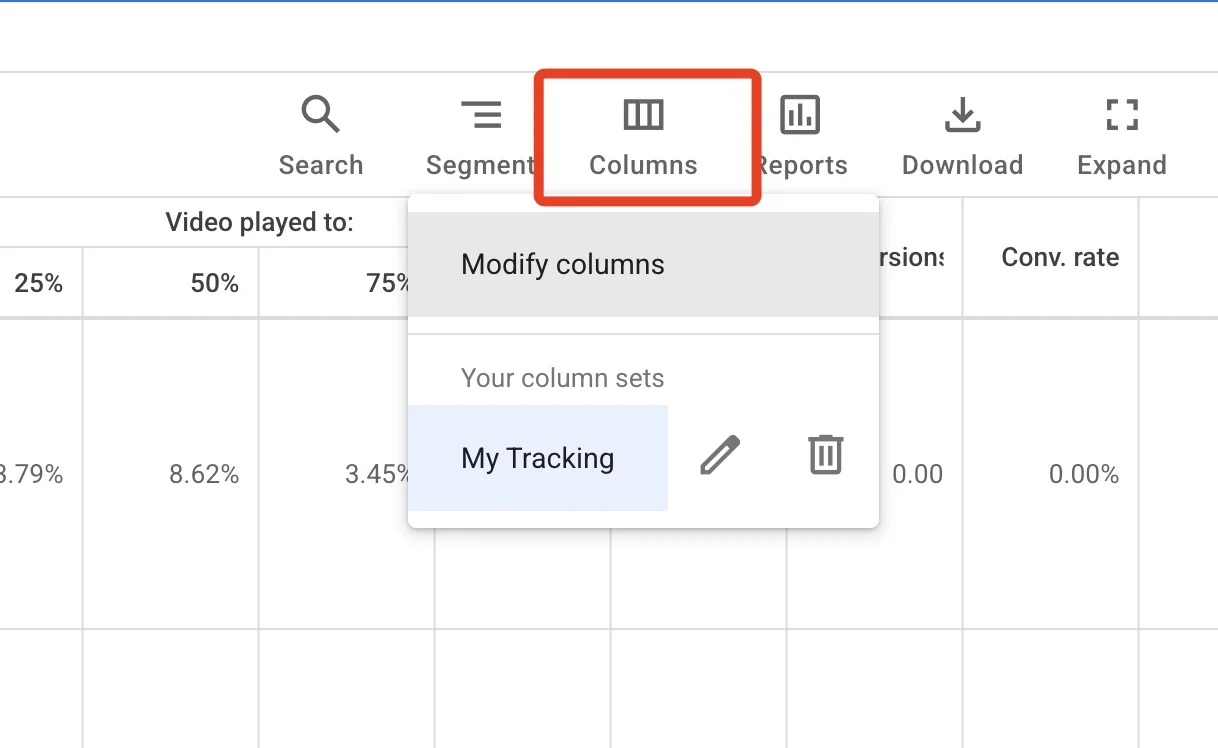
Then choose to create a custom column.
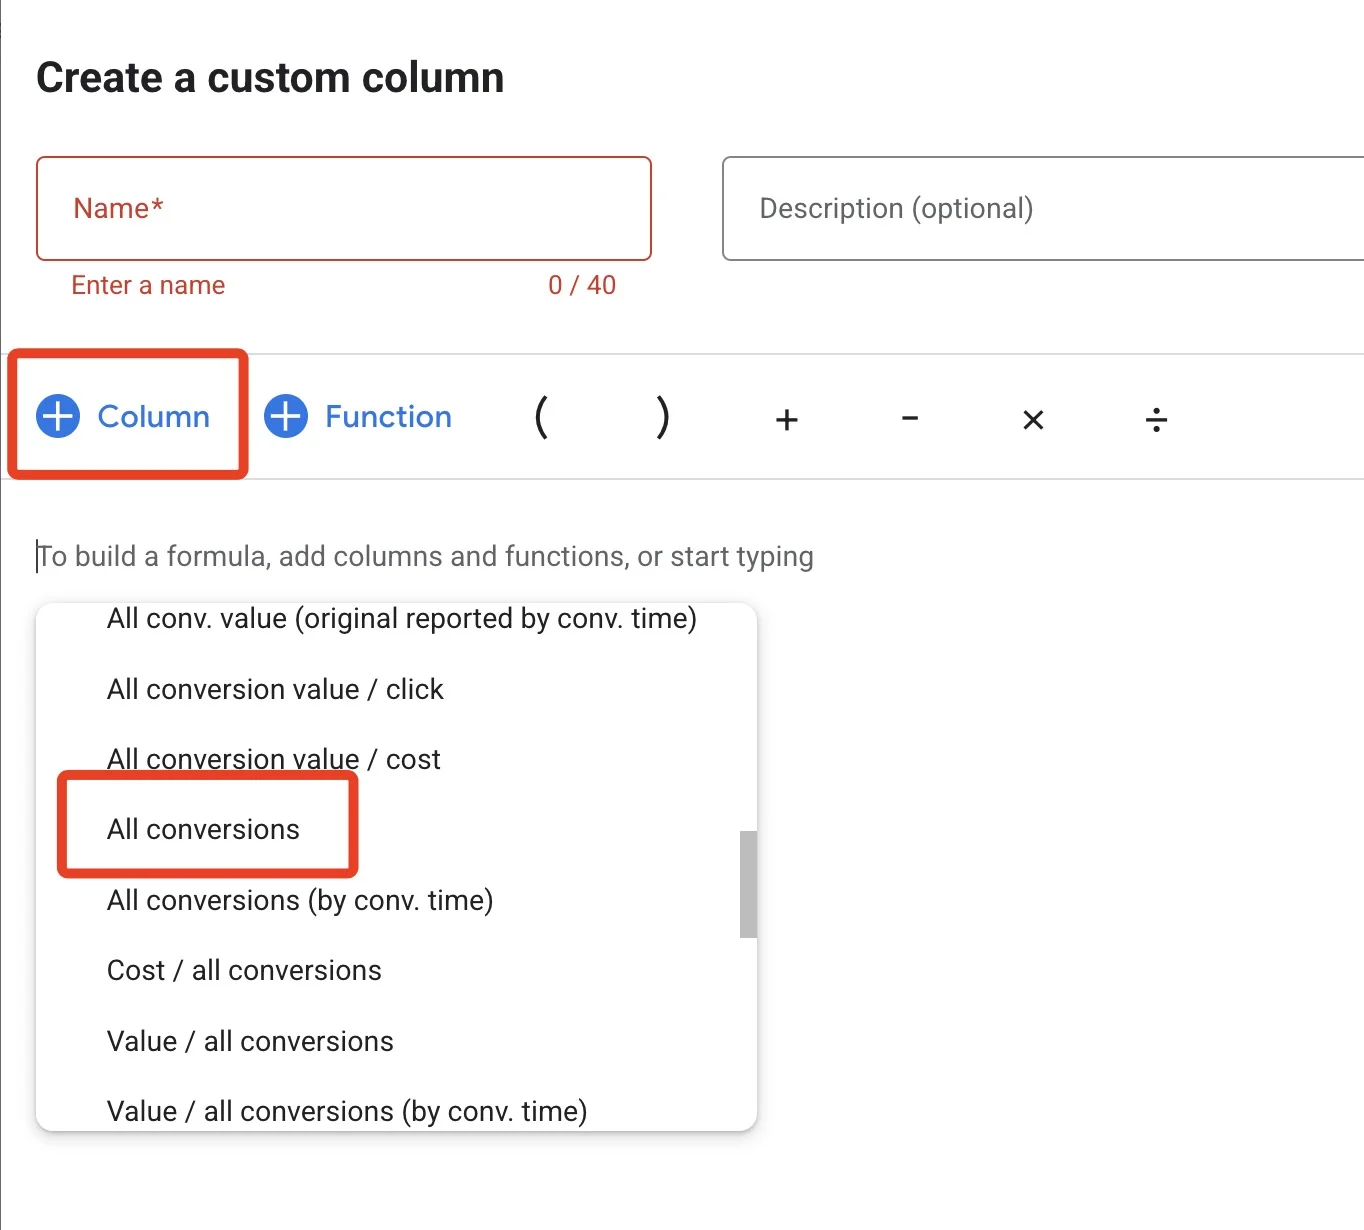
From there, select Conversions or All conversions.
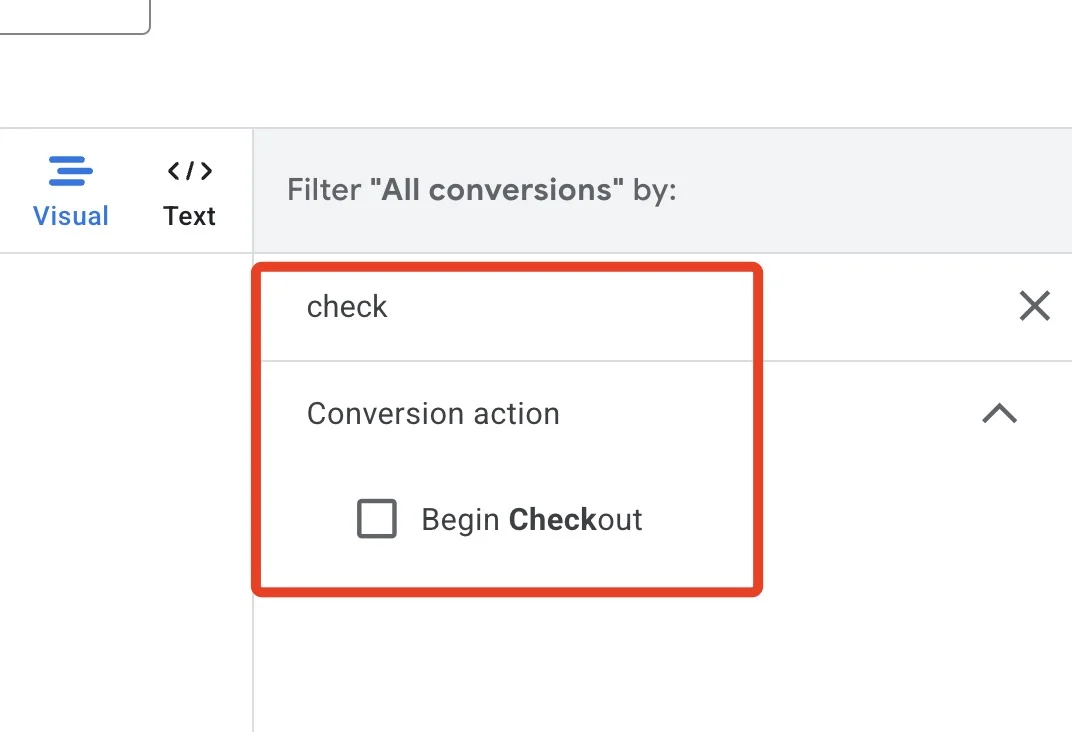
Then pick the conversion value you want to track, like checkout or landing page view, and save it.
Do that for each funnel step and you'll see the same chain right inside Google Ads. Landing page view, checkout, purchase, all lined up next to each other the way Facebook gives them to you out of the box.
To have these conversions as options in the custom columns, you need to create them inside Goals, then Summary.
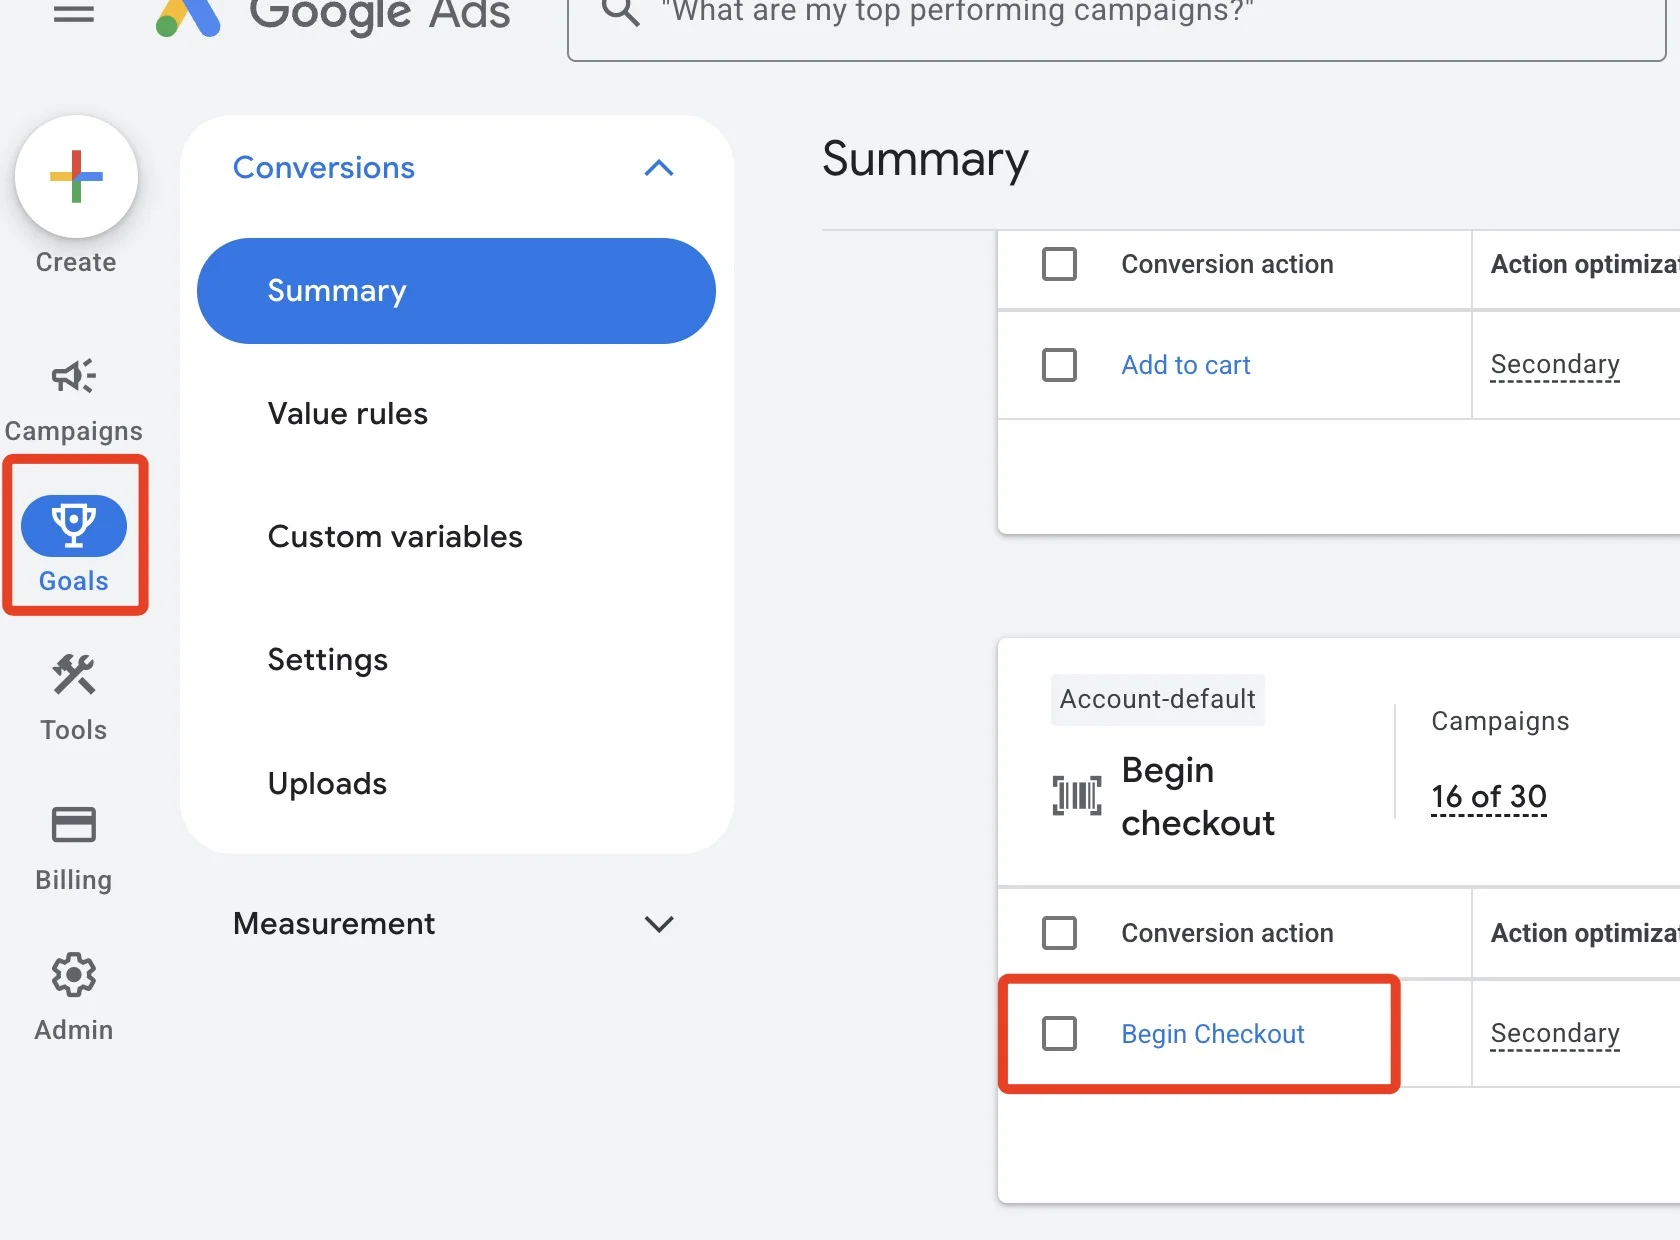
This is also where the setup matters, because these columns are only as good as the conversions feeding them.
With TrueMetriks, getting those conversions tracked and ready to read in your columns is straightforward, so the funnel steps are there to look at on either platform.
Better yet, you can read the same funnel steps right inside TrueMetriks, laid out cleaner than either ad dashboard shows them.
The map was already drawn
The columns in your ad account were drawing a map of exactly where your funnel leaks the whole time you were out testing new creative and swapping audiences.
So the next time the sales aren't there, don't change five things and hope. Read the steps in order, find the ratio that collapsed, and fix the one thing it's pointing at.